The Atmosphere Virtual Lab (AVL) is cloud platform that consists of jupyterlab workspaces, a publicly accessible zarr datacube containing atmospheric satellite data, and a map client to view this data. AVL also captures a set of freely available Open Source tools the are made available as the Atmospheric Toolbox.
Map Client
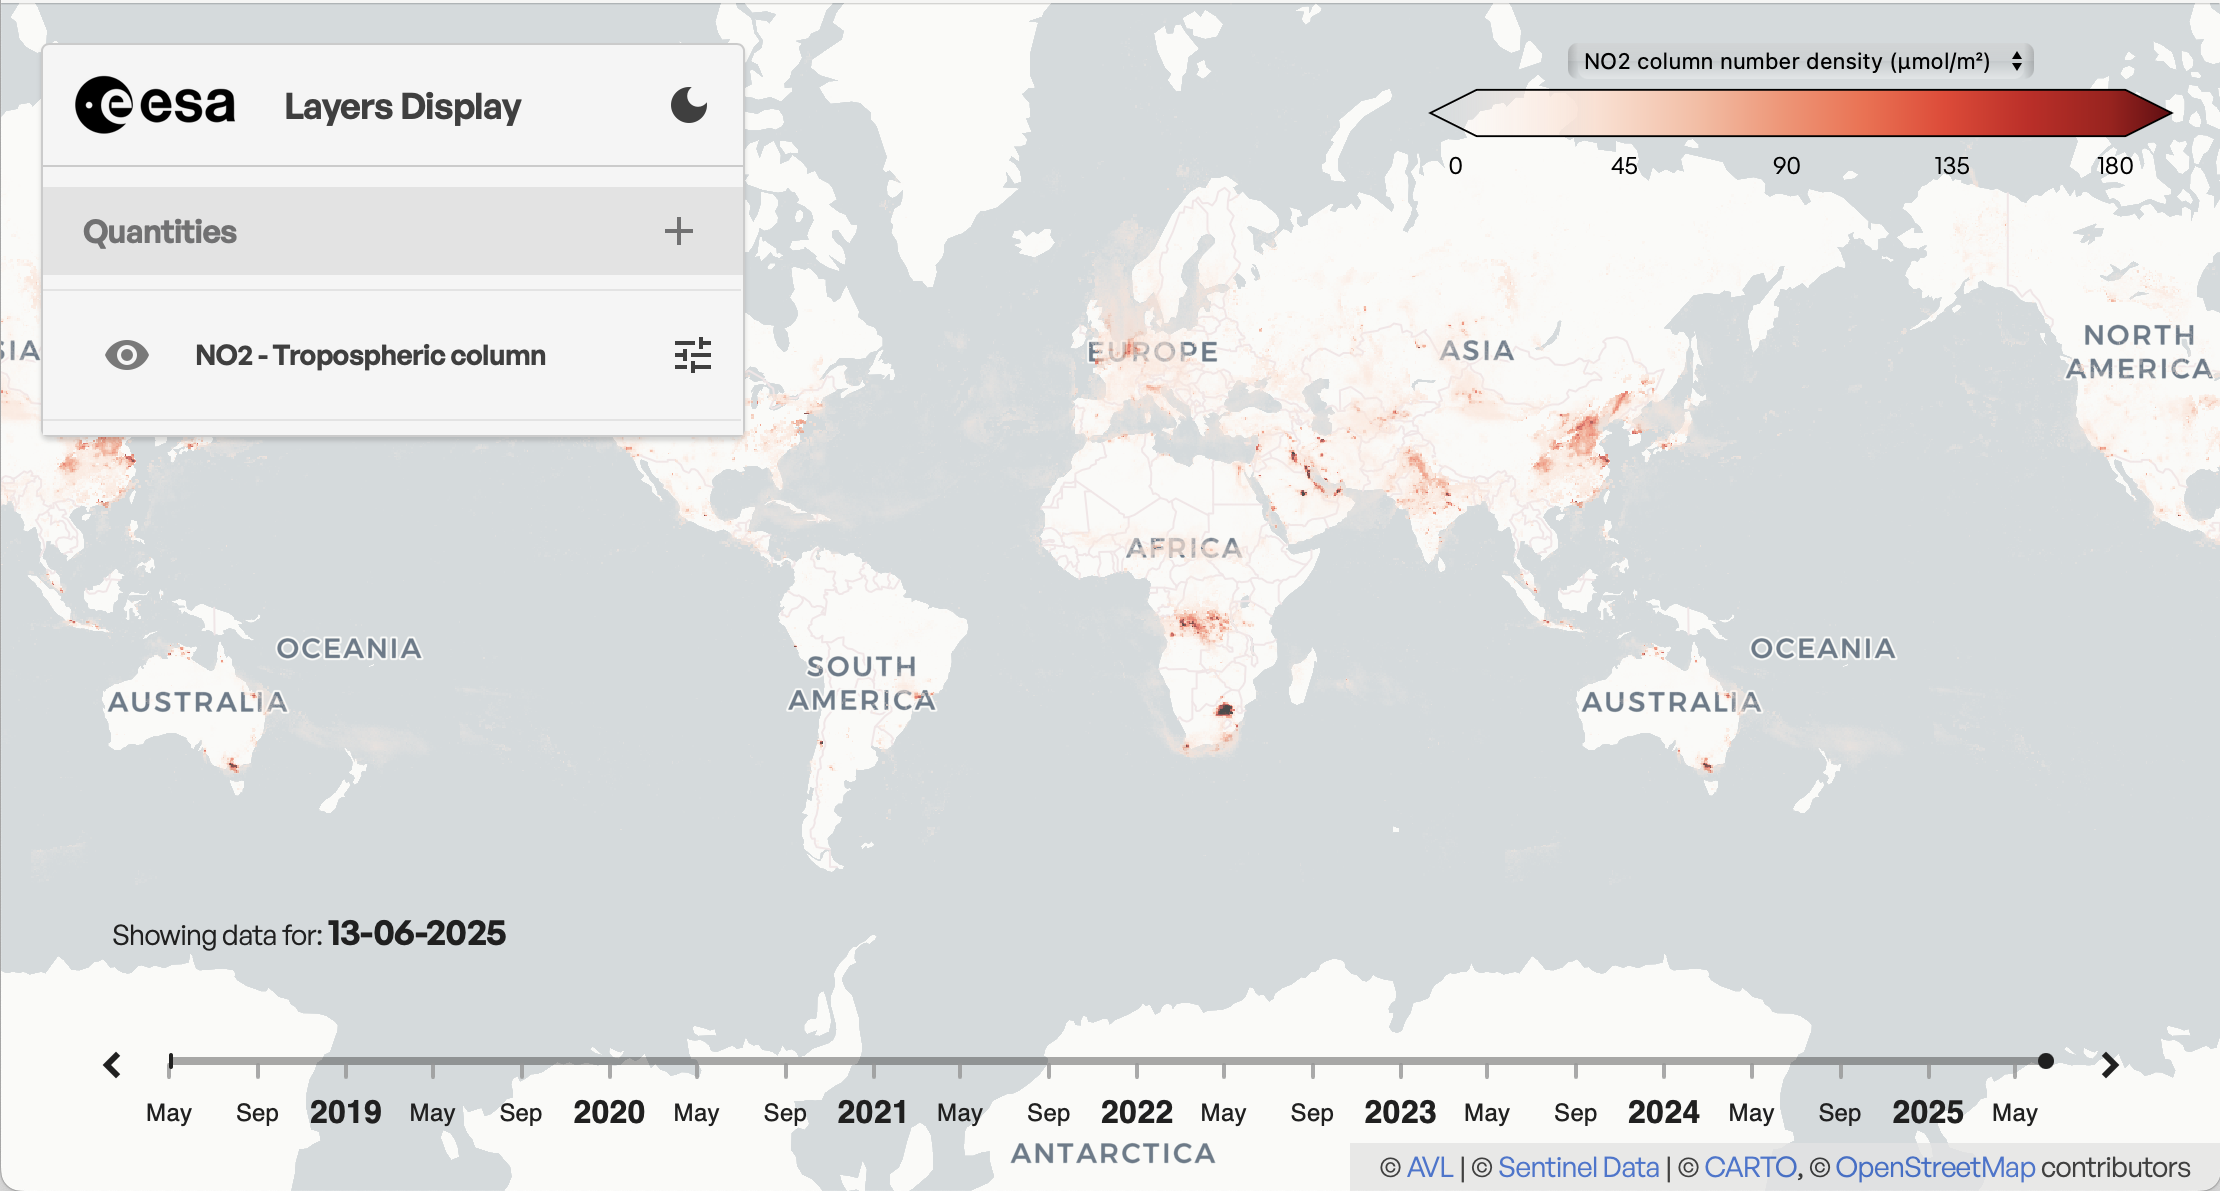
The interactive map client provides a graphical interface to all the atmospheric satellite L3 data that is available in the AVL datacube.
Datacube of Atmospheric Satellite Data
AVL hosts a datacube of atmospheric satellite level-3 data in zarr format.
The datacube is the primary input for the AVL map client which takes its data directly from this zarr store and applies on-the-fly color table mapping.
A unique feature of the AVL datacube is that it not only contains data at full resolution, but also at different lower resolutions (zoom levels). This allows the map client to efficiently show lower resolutions of the data without the need of server side processing. These lower resolutions are not only in space (lower resolution lat/lon grid), but also in time (providing monthly, seasonal, and yearly grids, in addition to the daily grids).
The datacube currently contains data from the Sentinel-5P mission, including level-3 gridded data from both operational and pre-operational L2 products. Data from additional atmospheric satellite missions are planned to be added in the future.
Note that the zarr datacube in AVL is currently still in beta and its structure and metadata are expected to change. Documentation on how to access the datacube and a description of the structure will be provided once the datacube becomes fully operational.
Jupyterlab Workspaces
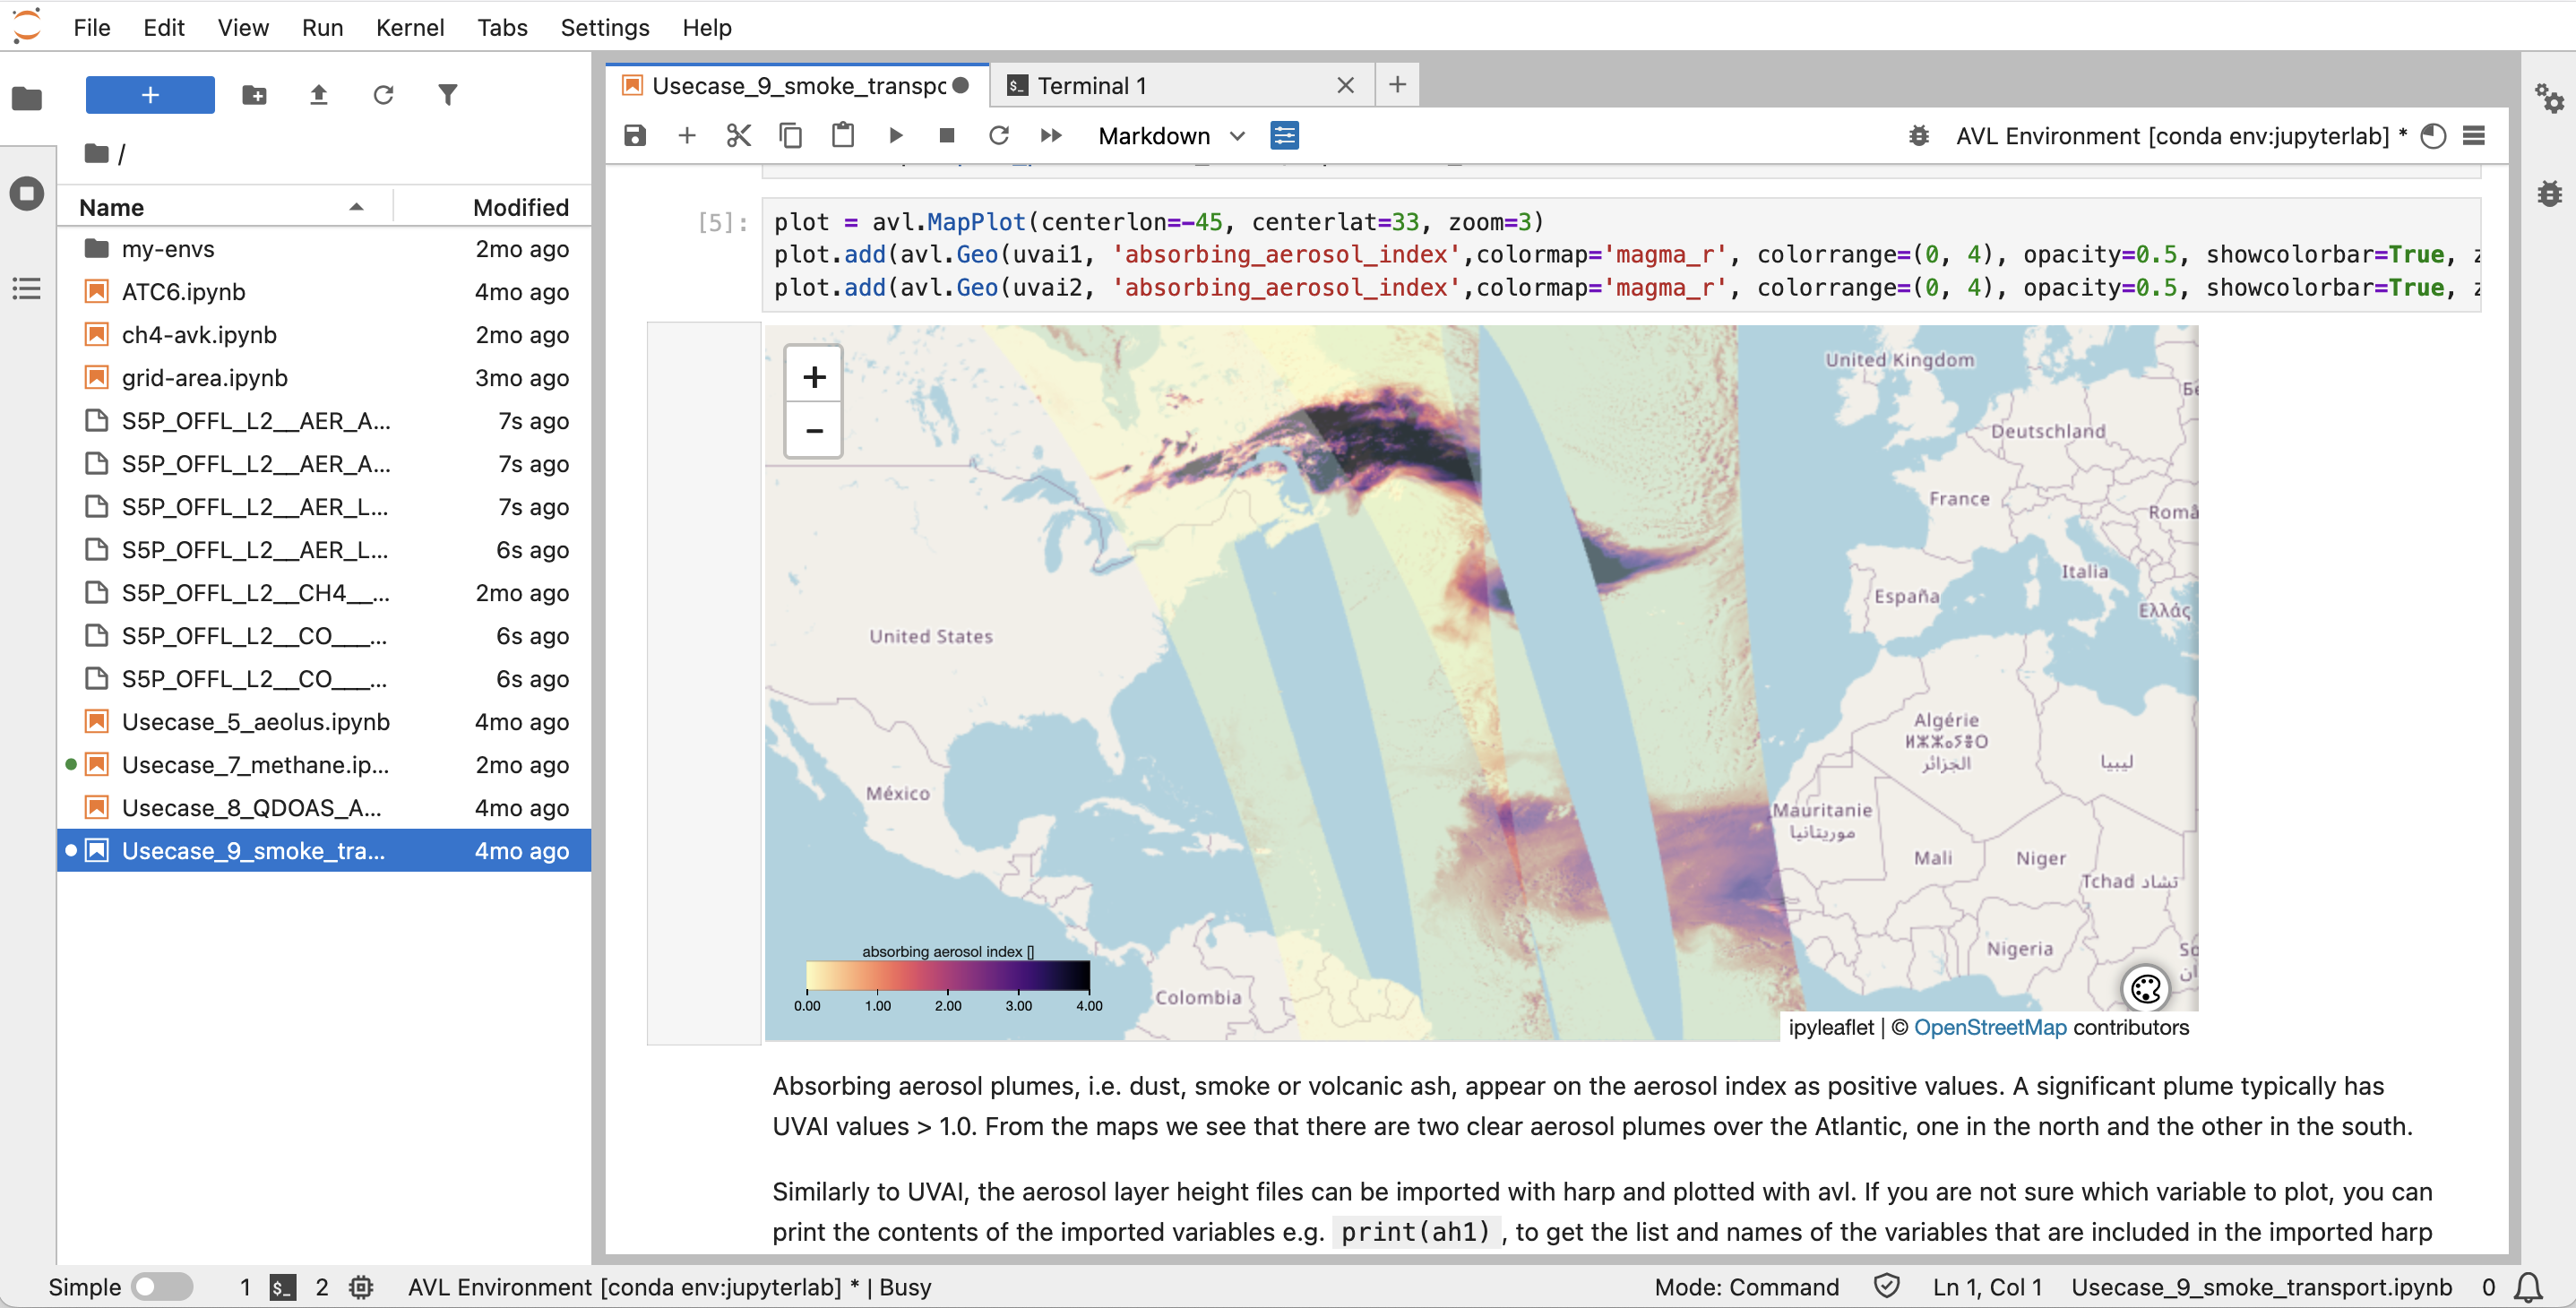
AVL provides registered users access to a Jupyterlab environment within the cloud environment with direct access to all Sentinel-5P L1b, L2 and L3 data.
To apply for access please contact the AVL Support Desk.
Support
For support, contact the AVL Support Desk or post a topic in the Forum.